

Reporting
One set of numbers, not four conflicting ones
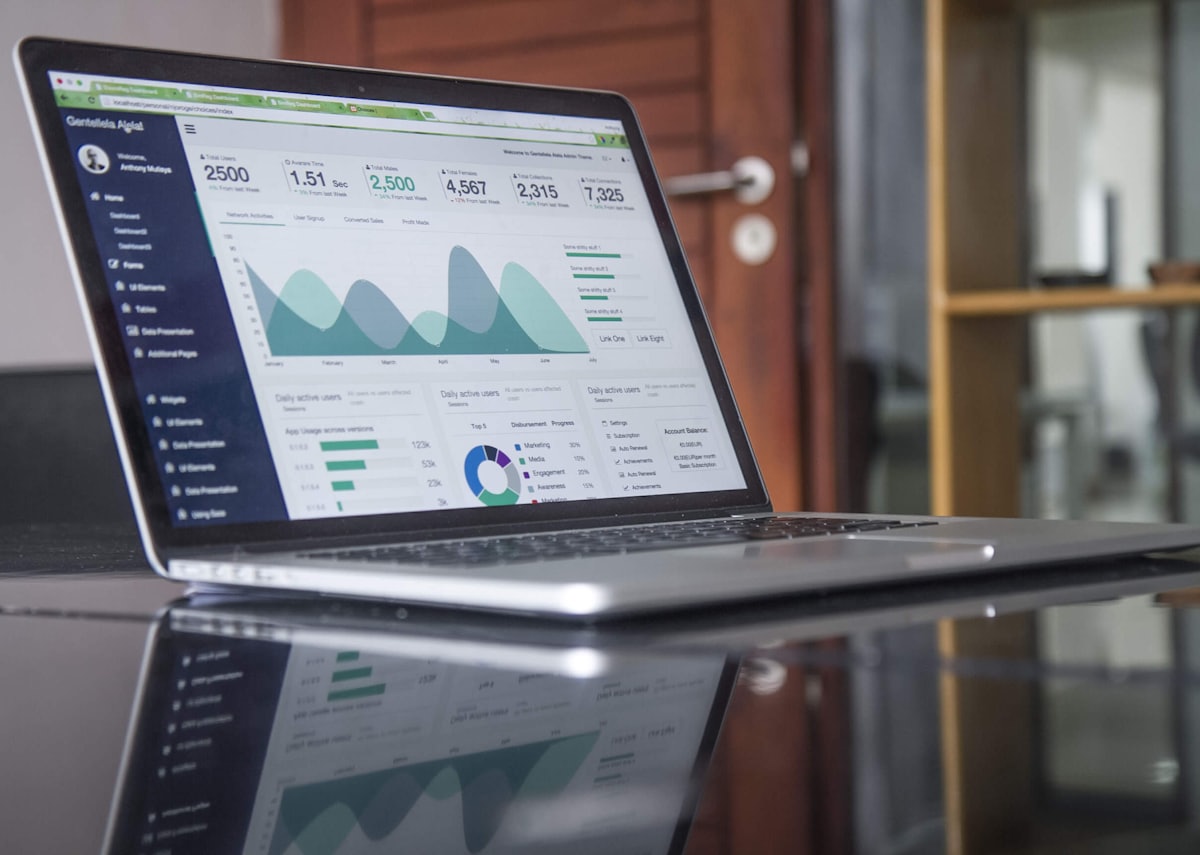
Reporting only helps when everyone agrees on the source. Because sales, stock and the ledger are the same data, a figure on a report is the figure in the record behind it.
What you get
- Sales performance by branch and by channel
- Stock valuation from recorded movements
- Purchase and supplier activity
- Cash session summaries
- Low stock and reorder visibility
- Figures traceable to the documents behind them
01
Compare like with like
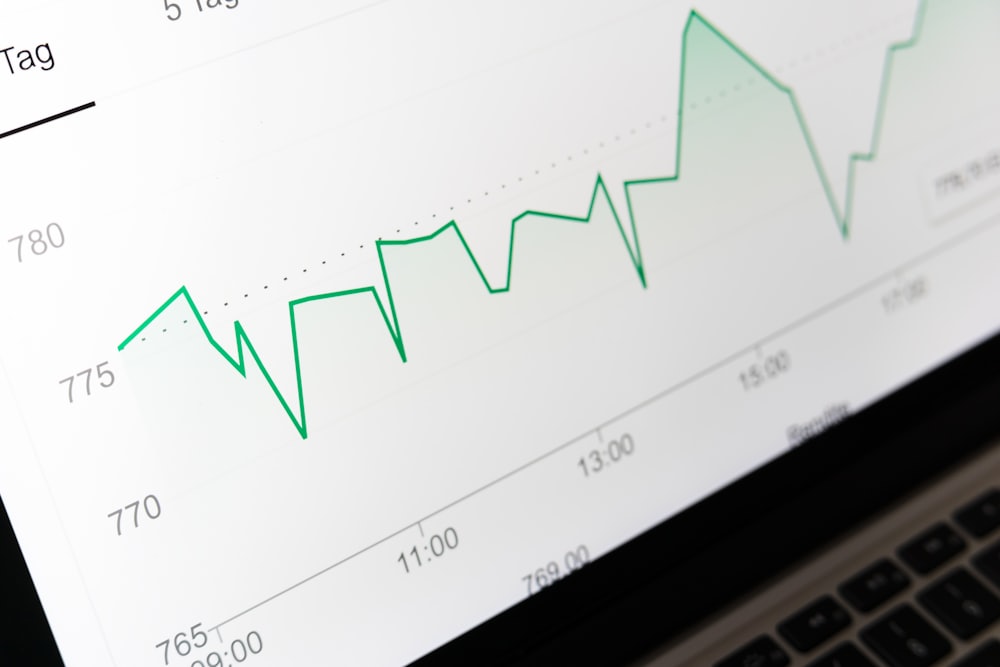
Filter by branch, by channel or by period and the comparison holds, because every channel wrote into the same tables in the first place.
- Branch and channel breakdowns
- Period comparison
- Consistent definitions across reports

02
Drill back to the document
A number that looks wrong should be answerable. Reports lead back to the sale, receipt or adjustment that produced them rather than ending at a total.
- Totals backed by source records
- Movement history per product
- Activity log alongside the figures
Works closely with

Try reporting on your own stock
Create an organization on the free plan, load some of your data, and see how it fits before you pay anything.
- Free plan, forever
- No card required
- Set up in about a minute